 |
| |
Mars Pathfinders' windsocks tell us more than just how fast the wind blows...
How does Mars' atmospheric pressure vary with time? Watch the "movie"!
Martian Weather Conditions
Temperatures, wind directions, pressures and cumulative graphs
Atmosphere Profile and Structure
Surface Meteorology
schofield_f1.gif (31K)
schofield_f2.gif (47K)This figure shows RSS acceleration from the three Pathfinder science acceleromaters plotted as a function of time during the Pathfinder spacecraft landing. Specific features are airbag deployment (1194 seconds), RAD motor firing (1198 seconds), the cutting of the bridal (1200 seconds), the first bounce (1204 seconds), and the second bounce (1210 seconds). 15 bounces are clearly shown before the high rate (32 Hz) data sampling period ends. Pathfinder is thought to have bounced and rolled for another 1 minute before coming to rest. The height of the peak shows how hard the lander bounced, and the time between peaks shows how high the bounce was (For example 6 seconds =3D 16.7 m, 5 seconds =3D 11.6 m, 4 seconds =3D 7.4 m, 3 seconds =3D 4.2 m, and 2 seconds =3D 1.9 m). This figure shows the variation with time of pressure (dots) measured by the Pathfinder MET instrument during landing period of Figure 1. The two diamonds indicate the times of bridal cutting and 1st impact. The overall trend in the data is of pressure increasing with time. This is almost certaily due to the lander rolling downhill by roughly 10 m. The spacing of the horizontal dotted lines indicates the pressure change expected from 10 m changes in altitude. Bounces may also be visible in the data.
schofield_f4.gif (31K)
dustdevil.gif (31K)This figure shows the signature of a dust devil that passed over the Pathfinder lander on Sol 25. Since then we have seen several similar features. The black line shows surface pressure plotted over a period of approximately two minutes. The sharp minimum approximately 0.5% below the background pressure is very clear. The dashed curves show raw data from two hot wire wind sensor elements (Blue =3D Wind Sensor 4 =3D East Wind, Red =3D= Wind Sensor 1 =3D West Wind). When the wind blows directly on an element it cools==2E. It is clear from the figure that the East wind increases suddenly as the dust devil approaches the lander and the pressure begins to fall. As the dust devil passes over the lander, pressure begins to rise, the East wind dies away and the West wind increases suddenly. Finally as the dust devil moves away, pressure returns to normal and the West wind dies away. This is a textbook dust-devil signature. This figure is a very simplified schematic drawing of the dust-devil that passed over the Sagan Memorial Station on Sol 25. It shows direction of motion and the graphs of a textbook dust-devil in terms of wind speed and surface pressure.
October 8, 1997 Press Conference Images
 |
| Here is a comparison of the most recent 24-hour met sessions. Note the general trend of increasing pressure with time into the mission. This indicates that the South polar cap is reducing, freeing C02 into the atmosphere. Also note small pressure features around noon, which we think are "dust-devils." |
 |
| In this figure you can see a significant increase in pressure on Sol 81. This is an indication of a frontal system has moved across the landing sight. |
 |
| This temperature figure shows the change in the mean and variance of the temperature fluctuations at the Pathfinder landing site. Sol 79 and 80 are very similar, with a significant reduction of the mean and variance on Sol 81. The science team suspects that a cold front has past of the landing sight between Sols 80 and 81. |
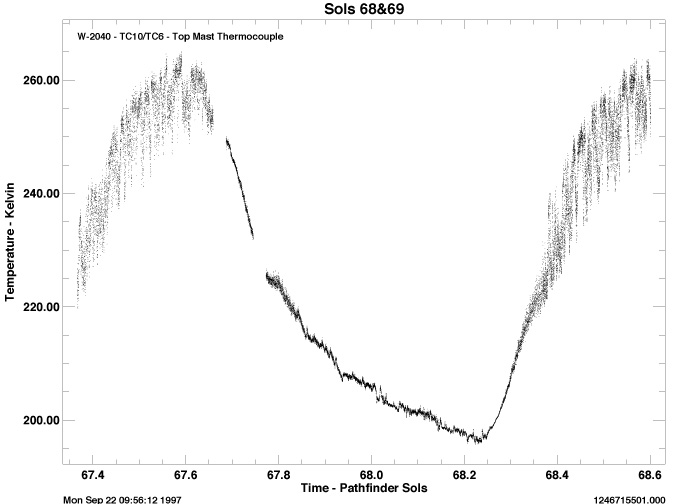
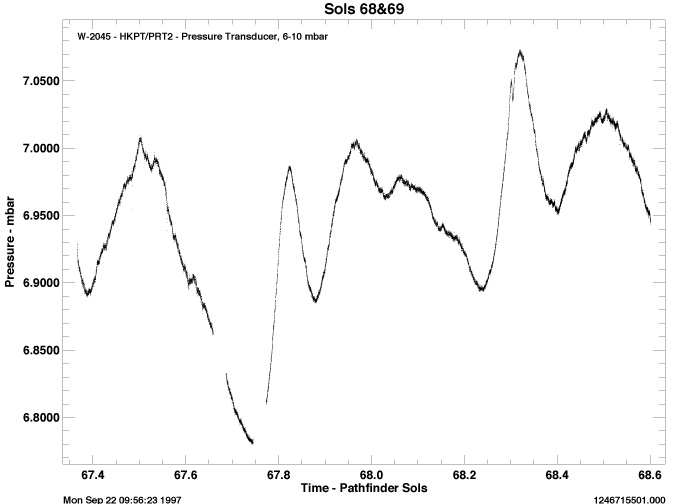
This figure shows temperature measured by the Pathfinder ASI/MET instrument, 1.0 m above the level of the lander solar panels, for a period of continuous measurement during Sols 68 and 69. Measurements are obtained every 4 seconds. Temperature is given in Kelvin, and time is expressed in Sols, where 68.0 is midnight at the end of Sol 68 and 68.5 is noon on Sol 69. Coverage extends from roughly 9 am on Sol 68 to 2:30 p.m. on Sol 69. Temperatures fall from a maximum of 265 K at about 2:30 p.m. to a minimum of 196 K just before dawn at 5:30 am. During the morning and afternoon, surface heating causes turbulent convection, and temperatures fluctuate rapidly by as much as 15-20 K. At sunset and sunrise the atmosphere is stable, and temperatures vary by significantly less than 1 K in the short term. During the night, the atmosphere is also stable with cold air near the surface, but is disturbed frequently by downslope winds which produce short-term temperature fluctuations of a few degrees. This figure shows pressure measured by the ASI/MET instrument during the period covered by the temperature figure described above. Both diurnal (daily), semidiurnal (twice-daily), and higher order variations can be seen clearly. Peak-to-peak variations are approximately 0.3 mbar, or 5% of the mean pressure. The daily pressure minimum occurs at sunset and the maximum is usually found shortly after sunrise. Narrow pressure minima, produced by 'dust devils', can be seen at Sols 67.486, 67.560, and 68.535.
The NASA Lewis Materials Adherence Experiment (MAE) on the Sojourner rover measures the dust deposited on the rovers' solar array by measuring the change in transparency of a movable glass cover as dust settles on it. These graphs shows the results from the first two and a half weeks of operation on Mars.
The rover solar array is seen to be accumulating dust at a rate of about a quarter of a percent of coverage per day. This is very close to the coverage of 0.22% predicted [G. Landis, "Dust Obscuration of Solar Arrays," Acta Astronautica, Vol. 38, No. 11, pp. 895-891 (1996)]. The deposition rate seems to be the same on the sols when the rover is in motion as it is on sols when the rover remains in place, indicating that the deposition is probably due to dust settling out of the atmosphere, not dust kicked up by Sojourners' motion.
 The dust deposition apparatus
is shown in the figure. Information on the experiment can be found at the Lewis web site.
The MAE solar cell experiment was built by Geoffrey
Landis of the Ohio Aerospace Institute and Phillip
Jenkins of Essential Research, Inc.
The dust deposition apparatus
is shown in the figure. Information on the experiment can be found at the Lewis web site.
The MAE solar cell experiment was built by Geoffrey
Landis of the Ohio Aerospace Institute and Phillip
Jenkins of Essential Research, Inc.