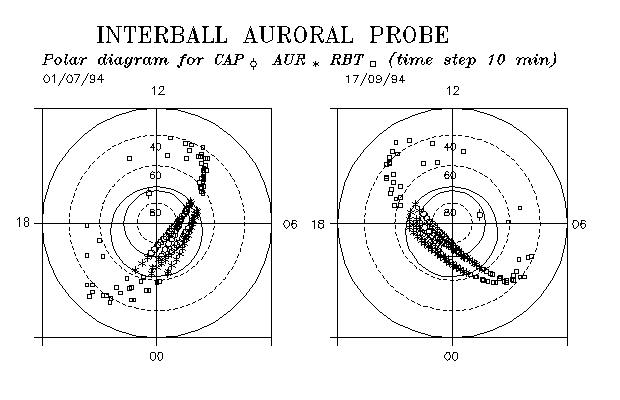
Fig. 5. A polar diagram of the AP magnetic field line footprints for two particular dates:
soon after launch and at the DTM date.
The corresponding geophysical regions are marked by different symbols.