INTERBALL TAIL PROBE
The long-term Situation Analysis for 1998
Click icons to make large pictures.
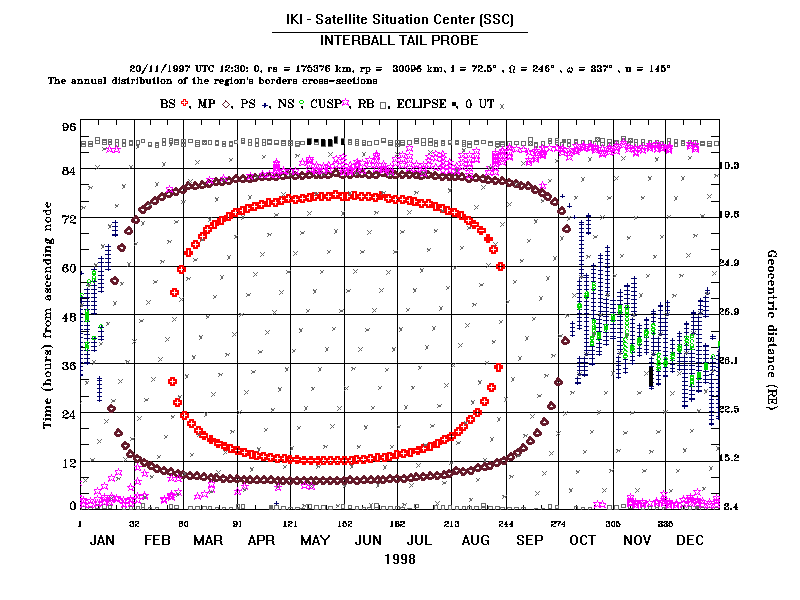 |
The annual distribution of the satellite locations in the geophysical regions
labeled by the regions marks.
The dates are shown along the X axis, The time on the orbit counted from ascending node of the each turn is shown along the Y axis. |
|
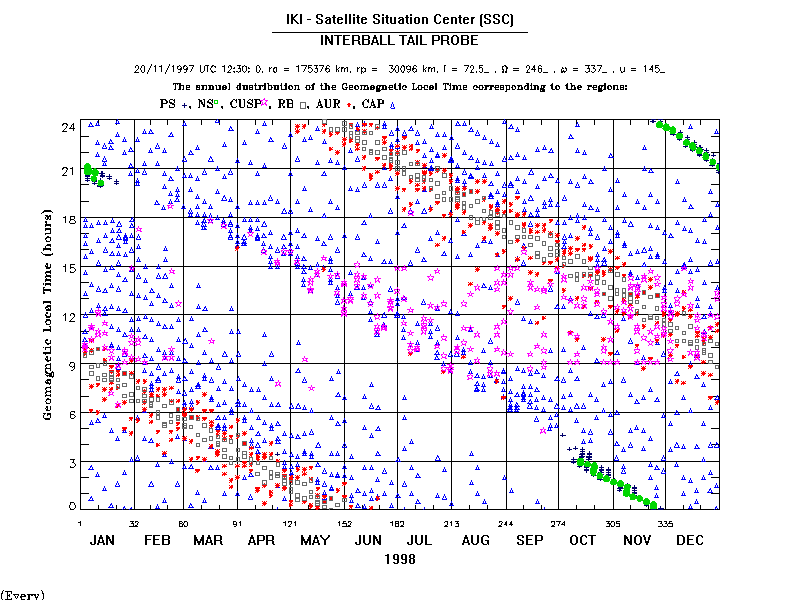
The annual distribution of the geomagnetic local time in the
satellite locations labeled by the geophysical regions marks.
The dates are shown along the X axis, The geomagnetic local time is shown along the Y axis. |
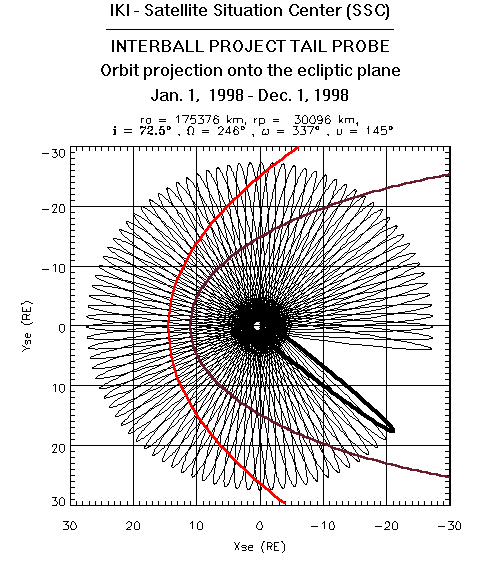
- Orbit in the Solar ecliptic coordinate system (projection onto the ecliptic plane)
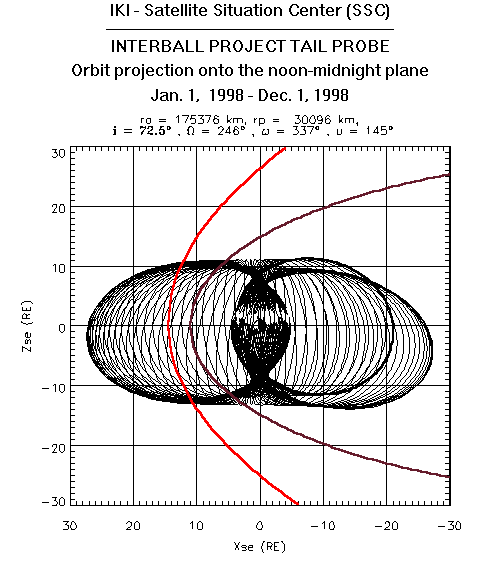
- Orbit in the Solar ecliptic coordinate system (projection onto the noon-midnight plane)
Dr. Victoria Prokhorenko
vprokhor@iki.rssi.ru
Dated 27 April 98